Raman spectroscopic detection and identification of Burkholderia mallei and Burkholderia pseudomallei in feedstuff
Burkholderia mallei (the etiologic agent of glanders in equines and rarely humans); Burkholderia (B.) mallei, the causative agent of glanders, and B. pseudomallei, the causative agent of melioidosis in humans and animals, are genetically closely related. The high infectious potential of both organisms, their serological cross-reactivity, and similar clinical symptoms in human and animals make the differentiation from each other and other Burkholderia species challenging. The increased resistance against many antibiotics implies the need for fast and robust identification methods. The use of Raman microspectroscopy in microbial diagnostic has the potential for rapid and reliable identification. Single bacterial cells are directly probed and a broad range of phenotypic information is recorded, which is subsequently analyzed by machine learning methods. Burkholderia were handled under biosafety level 1 (BSL 1) conditions after heat inactivation. The clusters of the spectral phenotypes and the diagnostic relevance of the Burkholderia spp. were considered for an advanced hierarchical machine learning approach. The strain panel for training involved 12 B. mallei, 13 B. pseudomallei and 11 other Burkholderia spp. type strains. The combination of top- and sub-level classifier identified the mallei-complex with high sensitivities (>95%). The reliable identification of unknown B. mallei and B. pseudomallei strains highlighted the robustness of the machine learning-based Raman spectroscopic assay.
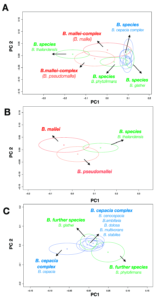
The PCA score plot shows the two directions of largest variance in the data and provides a valuable insight into the nature of Burkholderia’s Raman data. The spread of the data points of each Burkholderia species was visualized by the standard deviation ellipse for an overview. The colors codes the Burkholderia complexes. The obligate pathogen species of the B. mallei-complex are highlighted in red. The facultative pathogen species of the B. cepacia-complex are shown in blue and the nonpathogen B. phytofirmans, B. glathei, and B. thailandensis are visualized in green. A: The panel shows the whole Burkholderia data set (Model 1). B: Score plot of the p-ma-thai complex show three clusters (Model 2.1). C: Score plot of the remaining Burkholderia species (Model 2.2).
Read Abstract article by Prof. Dr. Jürgen Popp and his group: Identification of Burkholderia mallei and Related Species